01-Sep-2022
What is google analytics and how does it work
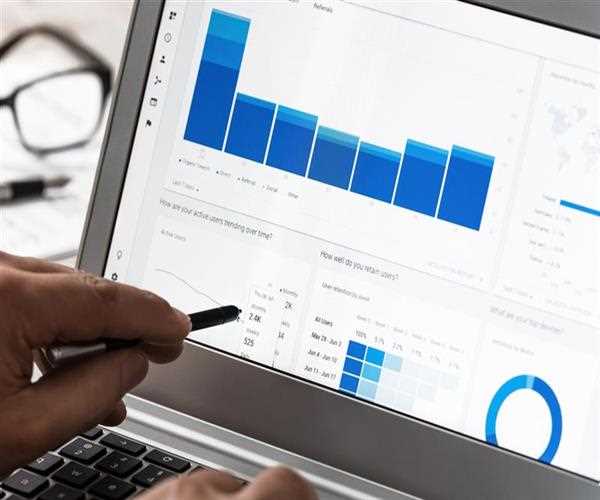
Google Analytics is a web analytics service that collects and analyzes information about user behavior. Every time a page loads, a Google Analytics measurement code collects data about the activity of your visitors. This activity is grouped into periods of time known as 'sessions.' A session begins when a user opens an app or webpage containing a measurement code, and ends when the user is inactive for 30 minutes. Returning users will start new sessions after this time has passed.
Overview of Google Analytics
- If you want to measure the performance of your website, you can start by checking the statistics. You can do this by using a Google Analytics report. Google Analytics is a free tool that has many features. You can track a variety of metrics and view data in table form. For example, you can see how many visitors click on a particular page and on which pages. You can also compare your website's data to that of other websites in your industry and subcategories.
- Google Analytics has many tools that help you optimize your website for better conversion rates. You can also set up alerts to know when your website is underperforming compared to others. It can also tell you how effective your internet marketing efforts are. For example, you can use the data to find out how your website ranks for competitive keyword phrases.
Audience report
- The Audience report in Google Analytics is a great place to learn more about your website's users. You can see which users are of what age and gender, as well as how they find your site. You can also learn more about what they're interested in by examining the demographics of your audience. The Audience report will also provide you with important information on which of your visitors are most likely to buy from your website.
- Understanding your audience is important for enhancing your conversion rate. By segmenting your site's visitors based on their interests, you can create a better experience for your customers. This will help you deliver more targeted messages and get more mileage from your marketing budget. Personalized messaging is the future of marketing, and your audience expects it. For example, your PPC ads should be tailored to your customers' interests.
Dimensions
- In order to get a clearer idea of how users are moving through your website, you need to understand the different dimensions of Google Analytics. These dimensions can be quite useful for determining how effective your marketing campaigns are. They can also help you determine which pages are most effective in terms of conversions. Here are some of the main dimensions of Google Analytics:
- Default dimensions are the ones available in your reports, but there is also a feature called Custom Dimensions that lets you add your own. You can use these dimensions as secondary or primary dimensions, depending on your needs. For example, you can use the 'sessions' metric to see which of your website's pages are attracting the most visitors. This metric tells you who is visiting your site, while the 'conversions' metric shows you which visitors made purchases.
Metrics
- Metrics are the data points in your Google Analytics reports that show how visitors interact with your website. In your Google Analytics report, you may see Pageviews across your site, as well as calculated metrics, which are numbers that combine different data points to describe a relationship between them. For example, you may see a metric called bounce rate, which tells you the percentage of visitors who only visit one page.
- Metrics are also divided into two groups, called sessions and goals. In the first category, you'll want to see how many people are completing a specific goal, such as completing a contact form. In the second category, you'll want to see the number of page views per session, which measures the number of unique users who visited your site.
Scope of the service
- When you configure the scope of Google Analytics, you're essentially choosing a hierarchy of data that makes sense for your website. Basically, hits are any time a user views a page, and events are any time a user performs an action on your site. Page views are recorded when a user clicks on a CTA or opens a product page. A product-level scope shows user behavior by product and is ideal for e-commerce sites. At the page-view level, language is recorded.
The scope of a report is important because not all metrics are available for all dimensions. For example, if your website sells concert tickets, your users will visit several times before purchasing a ticket. They may also return to your site to look at other concerts. All of this data will be scoped throughout the user's lifetime on your website.

SEO and Content Writer
I am Drishan vig. I used to write blogs, articles, and stories in a way that entices the audience. I assure you that consistency, style, and tone must be met while writing the content. Working with the clients like bfc, varthana, ITC hotels, indusind, mumpa, mollydolly etc. has made me realized that writing content is not enough but doing seo is the first thing for it.
Join Our Newsletter
Subscribe to our newsletter to receive emails about new views posts, releases and updates.
Copyright 2010 - 2026 MindStick Software Pvt. Ltd. All Rights Reserved Privacy Policy | Terms & Conditions | Cookie Policy